How Corporate Earnings Support the Market Rebound
- Market Insights
- 5 mins

Get investing insights for US-connected global citizens.
Book a free consultation with our cross-border advisors.
Financial markets have been resilient in recent weeks, almost fully recovering from the swings experienced at the beginning of August. Major stock market indices are once again approaching all-time highs, with the S&P 500 gaining 19.2% year-to-date with dividends, less than half of one percent below its peak. This upward trend has been fueled by Fed Chair Powell’s recent speech that laid the groundwork for a September rate cut. The past month is yet another reminder that market volatility is both natural and unavoidable. Rather than fixating on day-to-day market headlines, it’s usually better to invest based on longer-run trends.
Corporate earnings drive market returns in the long run

Past performance is not indicative of future results
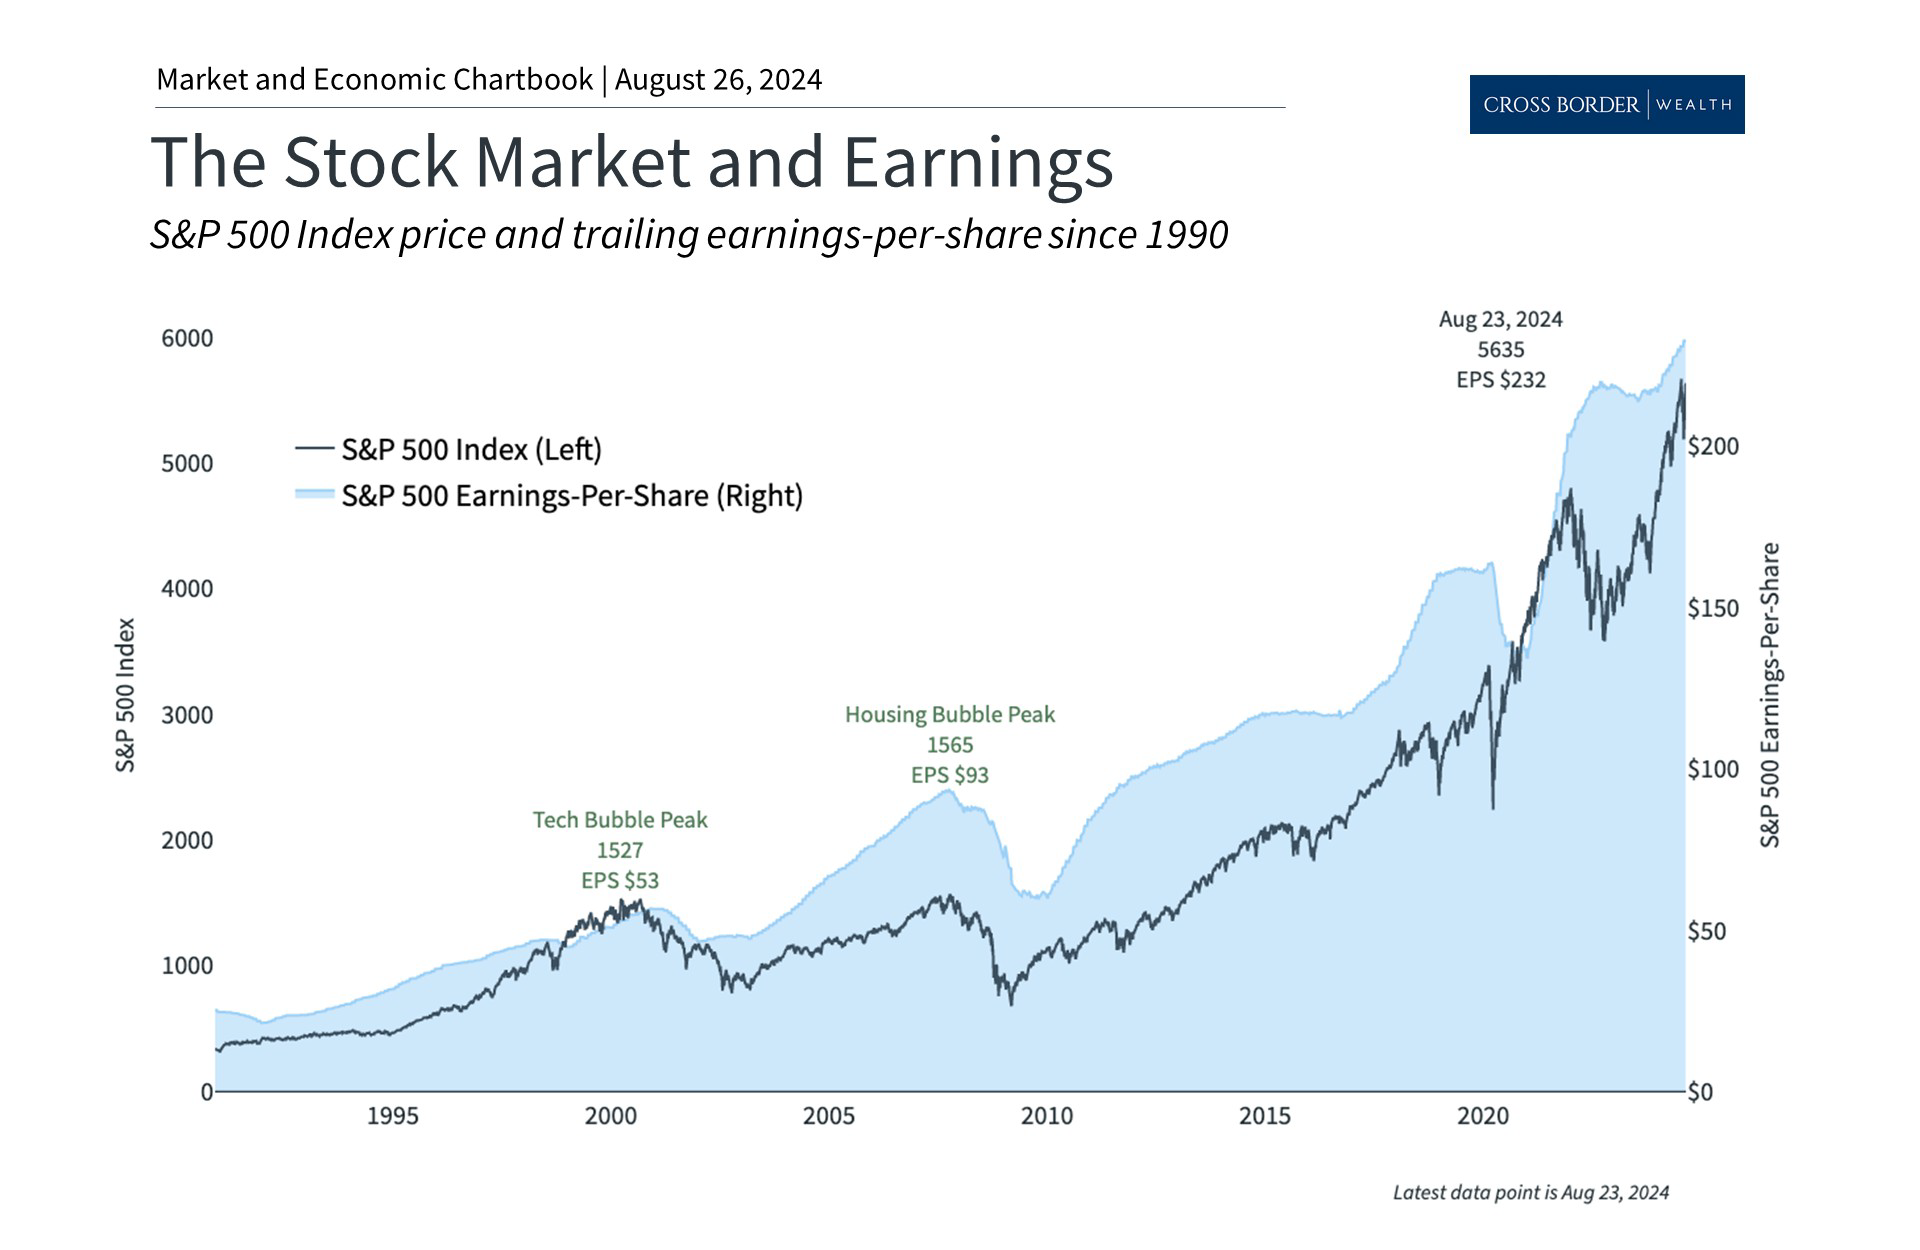
With market volatility subsiding for now, investors have shifted their attention back to fundamentals such as corporate earnings. Over the course of market cycles, the stock market tends to mirror the trajectory of corporate profits, rising as the economy grows. This is because shares of a stock represents an ownership claim on a company's profits. So, while markets can experience turbulence from time to time, a steadily growing economy and rising corporate profitability have historically fueled the stock market.
This is clearly demonstrated in the accompanying chart which shows that while markets and earnings do not move in perfect lockstep, they follow similar patterns. The gap between the two accounts for stock market valuations such as the price-to-earnings ratio – i.e., how much investors are willing to pay per dollar of earnings. Valuations have been expensive in recent years, so market pullbacks can be healthy as investors adjust their expectations.
Over the past twelve months, S&P 500 earnings have risen to $232 per share, a healthy growth rate of 7.4%. This has accelerated with second quarter S&P 500 earnings rising at a blended growth rate of 10.9%, according to FactSet. If the final numbers don’t change much, this will represent the fastest pace since the end of 2021. Earnings began to rebound just over a year ago after struggling in 2022 and early 2023 due to recession concerns.
While it’s positive that 79% of S&P 500 companies have reported higher-than-expected earnings, they have only beaten estimates by 3.5% on average. This is partly because S&P 500 revenue growth is below the 5-year average of 5.2%. The direction of sales in the coming quarters will depend heavily on whether consumers and businesses spend more or tighten their belts.
Companies are concerned about consumer spending

Past performance is not indicative of future results
This is one reason companies are concerned about the financial health of consumers, especially given the economic swings and rapid inflation of the past few years. It’s no secret that the prices of everyday necessities such as food and housing have remained high. On their latest earnings calls, many companies cited worries about consumers being more budget-conscious with their decisions when it comes to restaurants, vacations, entertainment, and so on. This was echoed by executives from Marriott, McDonald’s, Disney, and more.
On the one hand, the latest consumer spending data came in hotter than expected, showing a 1% month-to-month jump in retail sales compared to expectations of just 0.3%. On the other hand, it’s also clear that savings rates have fallen from their pandemic peaks, acting as a drag on future spending. The accompanying chart shows that much of the extra money from each paycheck that households were able to save in 2020 and 2021 has already been spent. While this has not materially slowed consumer spending just yet, it is a factor that investors and economists have been following for some time.
It's also clear that consumer sentiment is still poor due to the higher prices of the past few years. The University of Michigan’s Consumer Sentiment index is still well below average. In a recently published financial well-being index from Deloitte, sentiment appeared mixed. Among the highest earners, consumer sentiment is sunny, with 74% of higher income respondents saying their finances have improved in the last 12 months. Among middle- and lower-income earners, however, the outlook is less rosy, with just 61% and 50% of respondents respectively reporting improvement.
Consumer net worth is at record levels

Past performance is not indicative of future results
At the same time, there are early signs that consumers’ feelings about inflation are improving. A recent Survey of Consumer Expectations from the Federal Reserve Bank of New York revealed a significant drop in consumers’ expectations for inflation over the next three years, reaching a record low of 2.3% since the survey’s inception in 2013. The University of Michigan’s survey also showed that consumers anticipate only 2.9% inflation over the next year and 3% over 5-years, a significant improvement in recent months.
With inflation moving back toward 2%, the Fed poised to cut rates, and markets rebounding, household net worth has reached new all-time highs. Over time, the growing value of financial assets could help to support consumer spending and sentiment as well. This is often referred to as the “wealth effect” and, when business cycles are in their expansionary stage, historically drives further growth.

Cross Border Wealth is a SEC-registered investment adviser which may only transact business in those jurisdictions in which it is registered or qualifies for an exemption or exclusion from registration requirements.
Cross Border Wealth may discuss and display charts, graphs, formulas, stock, and sector picks which are not intended to be used by themselves to determine which securities to buy or sell, or when to buy or sell them. This specific information is limited and should not be used on their own to make investment decisions.
All information provided in this article is for educational purposes only and does not intend to make an offer or solicitation for the sale or purchase of any specific securities, investment, or investment strategies. Please ensure to first consult with a qualified financial adviser and or tax professional. Further, please note that while said information has been obtained from known sources which are believed to be reliable, none of these are guaranteed.


