- Market Insights
- 5 mins

For investors trying to understand the economy, recent reports have provided mixed signals, even leading President Trump to fire the Bureau of Labor Statistics commissioner. The latest jobs numbers showed weakness and negative revisions, but there are also signs that GDP growth rebounded in the second quarter. Corporate earnings continue to beat expectations, driving markets to new all-time highs, while tariffs and inflation remain concerns.
These conflicting data points create uncertainty for investors and policymakers, making it challenging to make financial decisions when the numbers themselves are questioned.
The issue isn't just that different reports are telling different stories today, but that understanding the economy is never as simple as watching just one or two indicators. Knowing how to interpret the economic data is crucial for making informed decisions - including jobs, inflation, productivity, fiscal policy, and much more.
Rather than reacting to individual reports, successful investing requires knowing what weight to place on each one and how to look for broader trends. In today’s uncertain economic environment, what should investors be watching as they manage their portfolios and financial plans?
The jobs report raises concerns about the economy
Past performance is not indicative of future results
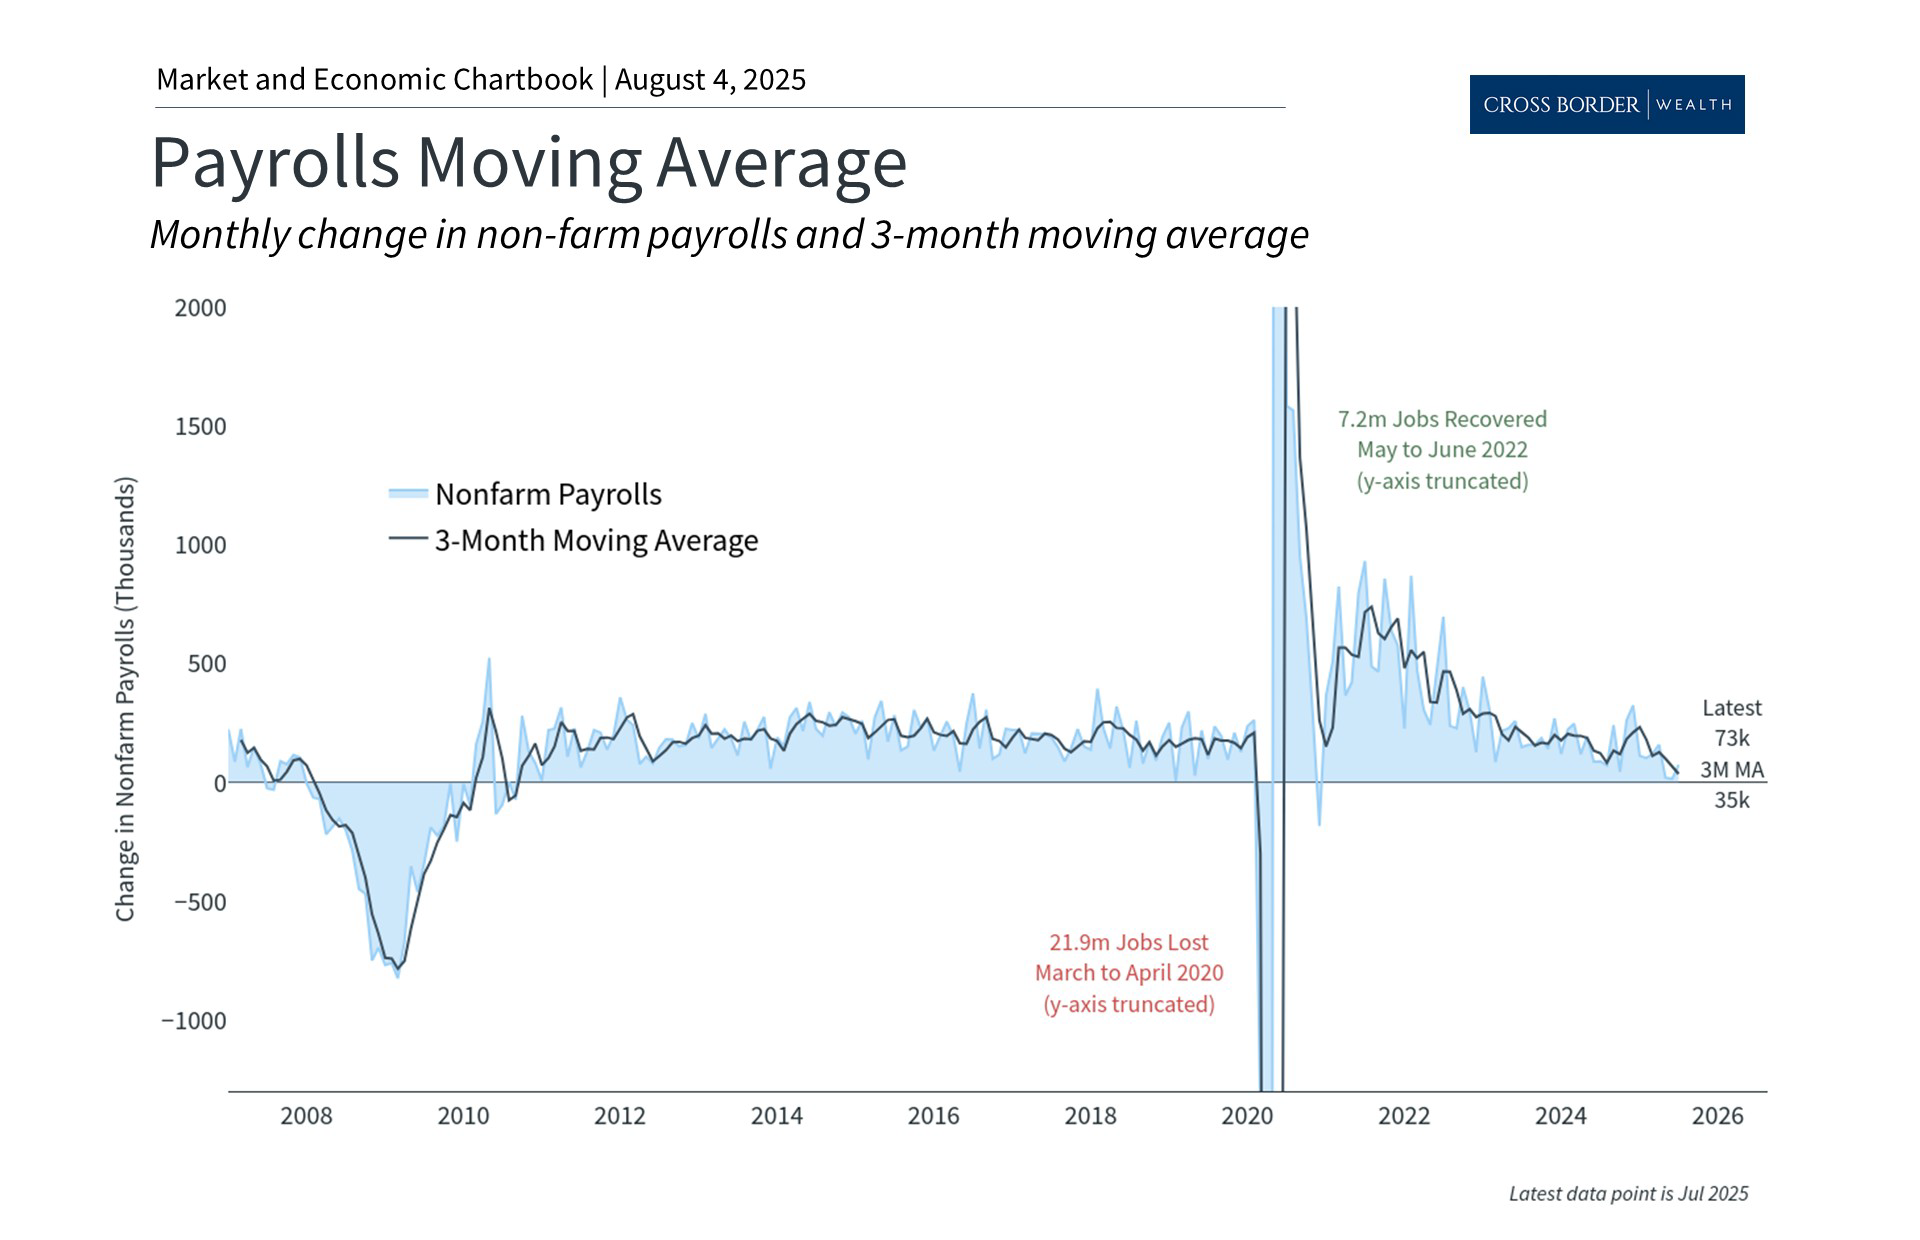
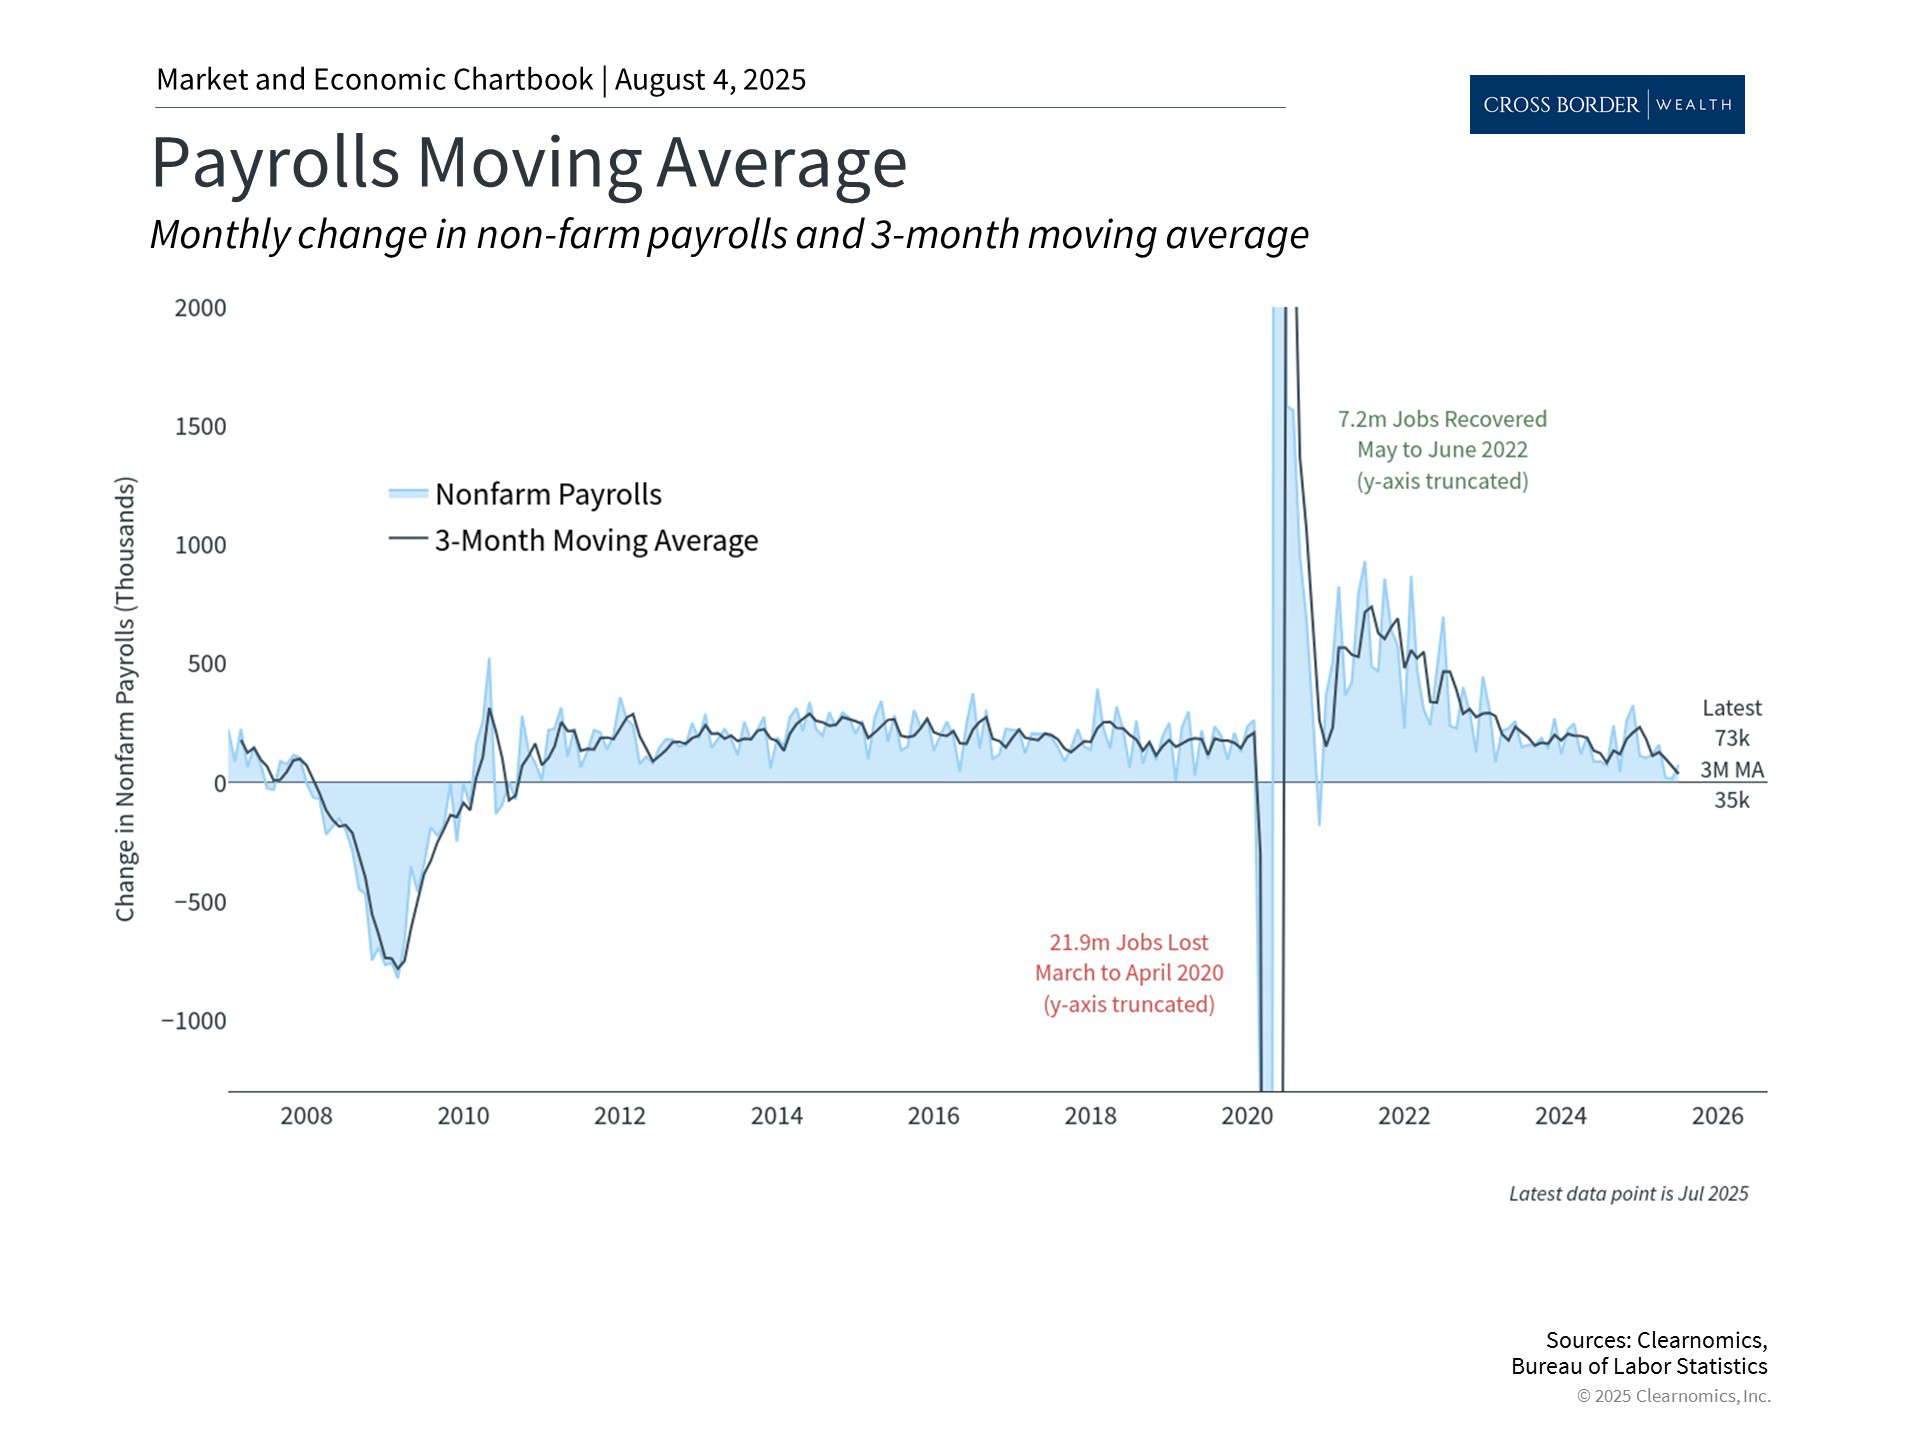
The latest jobs report raised concerns when it showed that only 73,000 jobs were added in July, well below economist expectations. Additionally, there were substantial downward revisions to the May and June employment figures, which together showed that there were 258,000 fewer jobs than previously reported. This means the economy was significantly weaker over the past few months than originally thought.
The size of these revisions has fueled concerns over whether government figures are trustworthy. This is a challenge because government data serves as the foundation for understanding economic trends. Whether it's employment figures from the Bureau of Labor Statistics, GDP calculations from the Bureau of Economic Analysis, or inflation measures from multiple government agencies, these statistics guide everything from Federal Reserve policy to portfolio decisions.
In today's politically divisive climate, the reliability of this data matters even more. So, it’s important to understand a few key facts.
Economic data forms the foundation for investment decisions
Past performance is not indicative of future results
First, why is this an issue? Some things in life are simple enough that they can be counted. For example, the number of workers at a company, the number of layoffs, or the average size of annual raises, can all be calculated with near-perfect accuracy. But when it comes to measuring these numbers across tens of millions of companies, or hundreds of millions of people, counting is not just impractical, but may be impossible. This is when statistics and estimation are needed.
So, government data sources, like any statistical data, are not perfect. The numbers come from surveys of thousands of businesses and households, conducted by professional data collectors and analyzed by statisticians and economists. The results are only as good as the surveys and methodology and should always be viewed as estimates rather than exact measurements.
Second, there is a tradeoff between timeliness, which investors and policymakers value, and precision, which requires time and additional information. Government economic reports are released on strict schedules and then revised multiple times as new data becomes available. This revision process is a strength of the system since it allows for continuous improvement in accuracy. However, it does mean that no individual number should be taken as fact.
Despite these limitations, U.S. government data is considered the gold standard by the industry and when compared to other countries. These agencies maintain high standards and serve as the primary source for many indicators. While their methodologies can always be improved (and often are), the agencies are staffed by professionals who have served under many different administrations.
Finally, tension between politics and government data is unavoidable since, on the one hand, there are strong incentives to show the economy in the best light, and, on the other hand, it is difficult to disprove whether an economic report is politically motivated. This has been true across many political environments.
It’s important to maintain a broad economic perspective
Past performance is not indicative of future results
Due to these challenges, it's important to look at many perspectives, including both public and private data, to get a clearer understanding of the economy. In investment research, this is often known as “mosaic theory,” or the idea that disparate pieces can form a comprehensive picture. Jobs, growth, inflation, corporate earnings, and consumer spending – from different data sources – all provide valuable pieces of the puzzle.
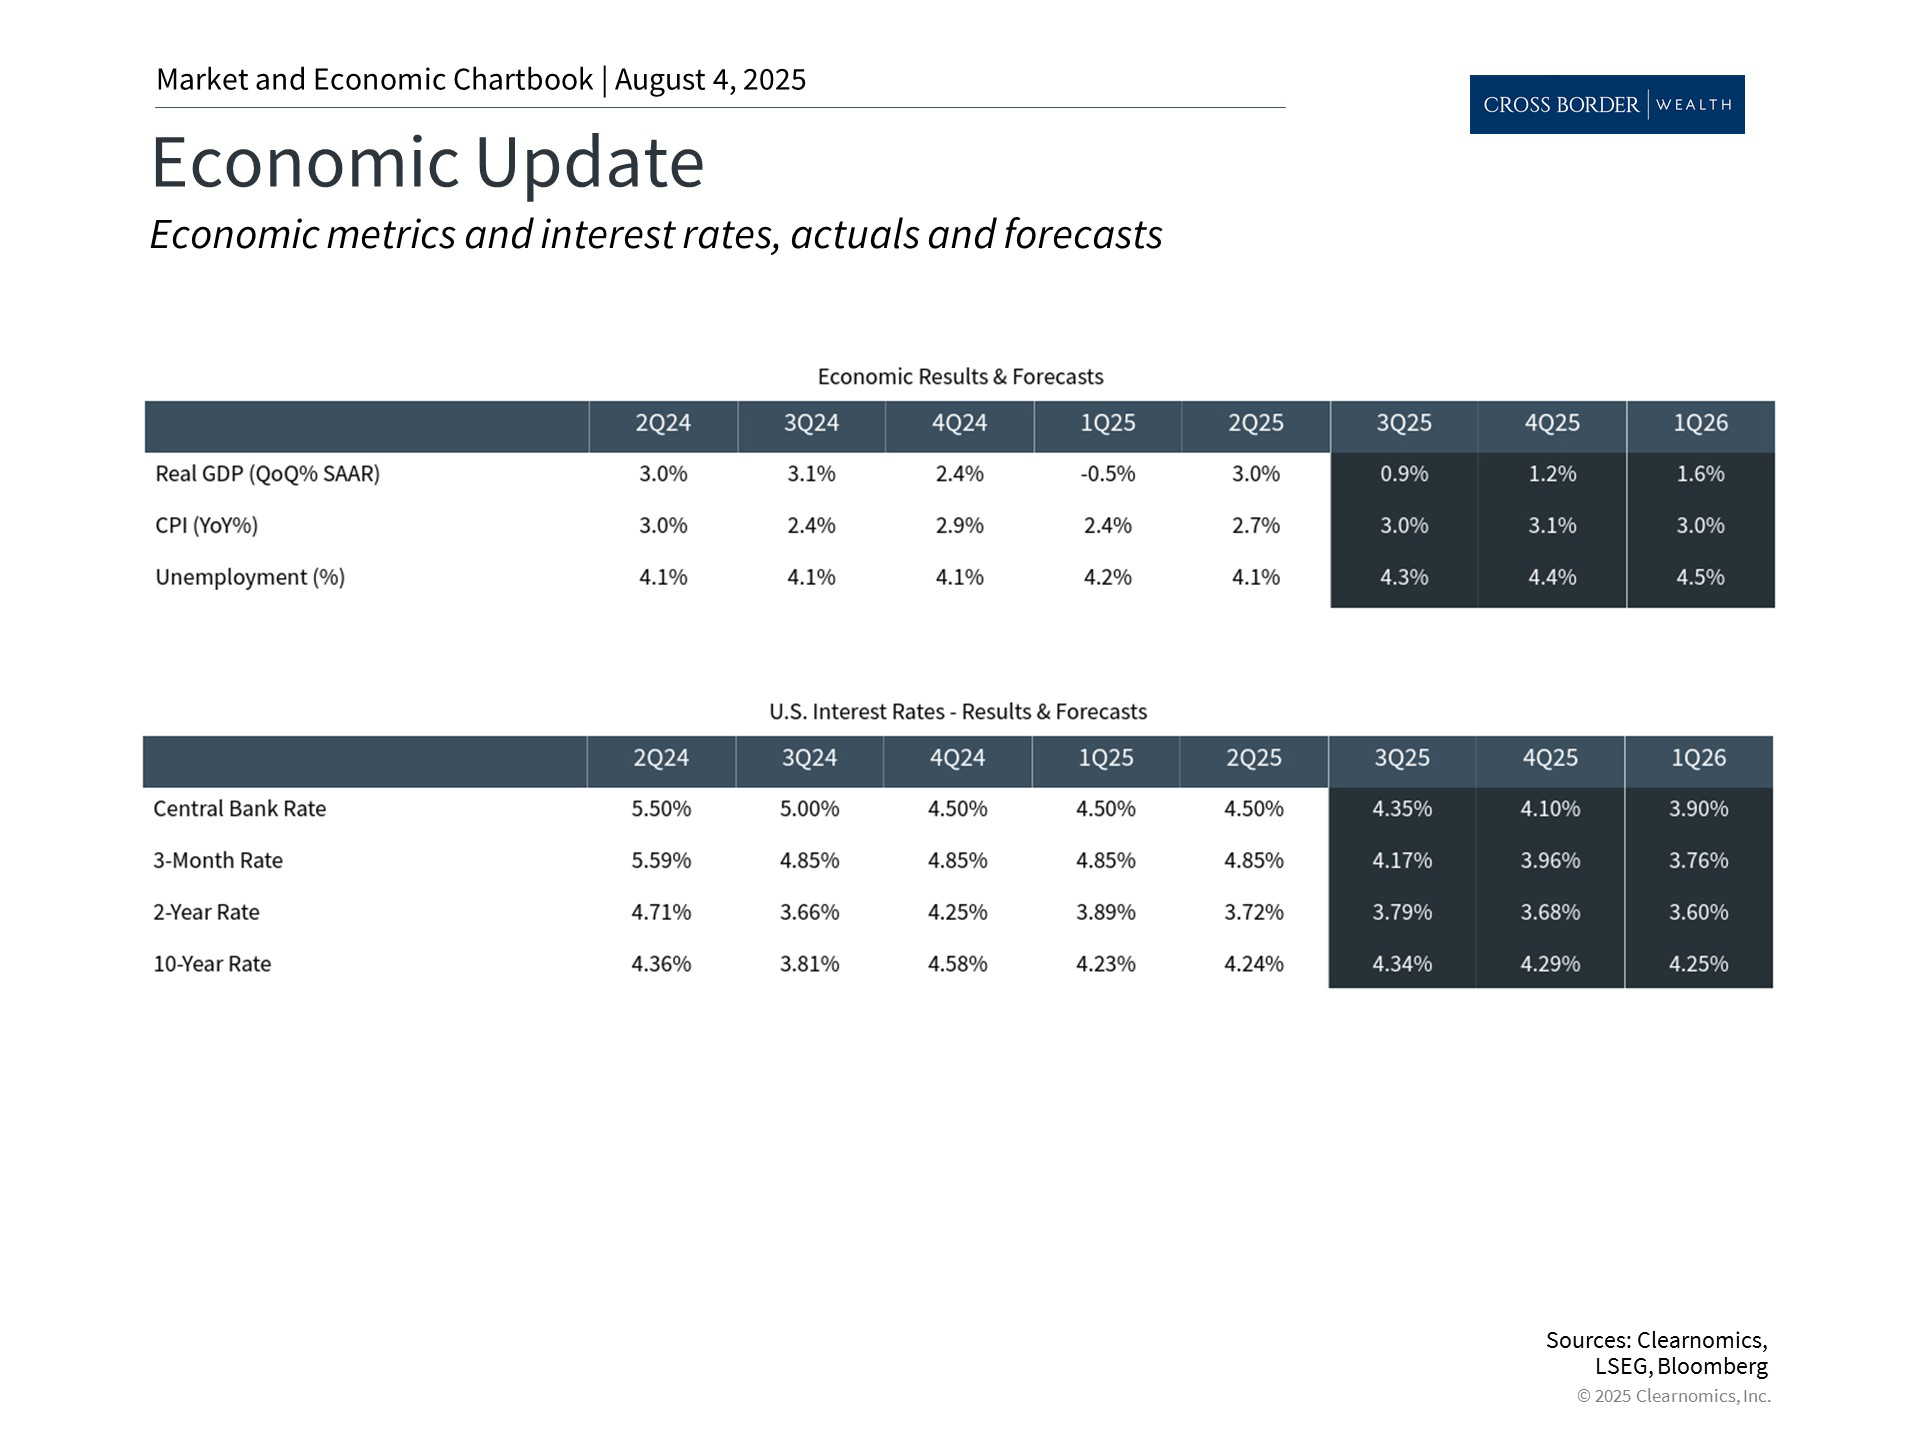
Much of the economics profession involves studying which indicators matter, how much, and when. For example, while the latest employment data is weaker than expected, other data suggests that the economy's overall output continues to expand at a healthy pace. Second quarter GDP growth accelerated to 3.0%, well above the long-term average, representing a reversal of the trends from the first quarter.
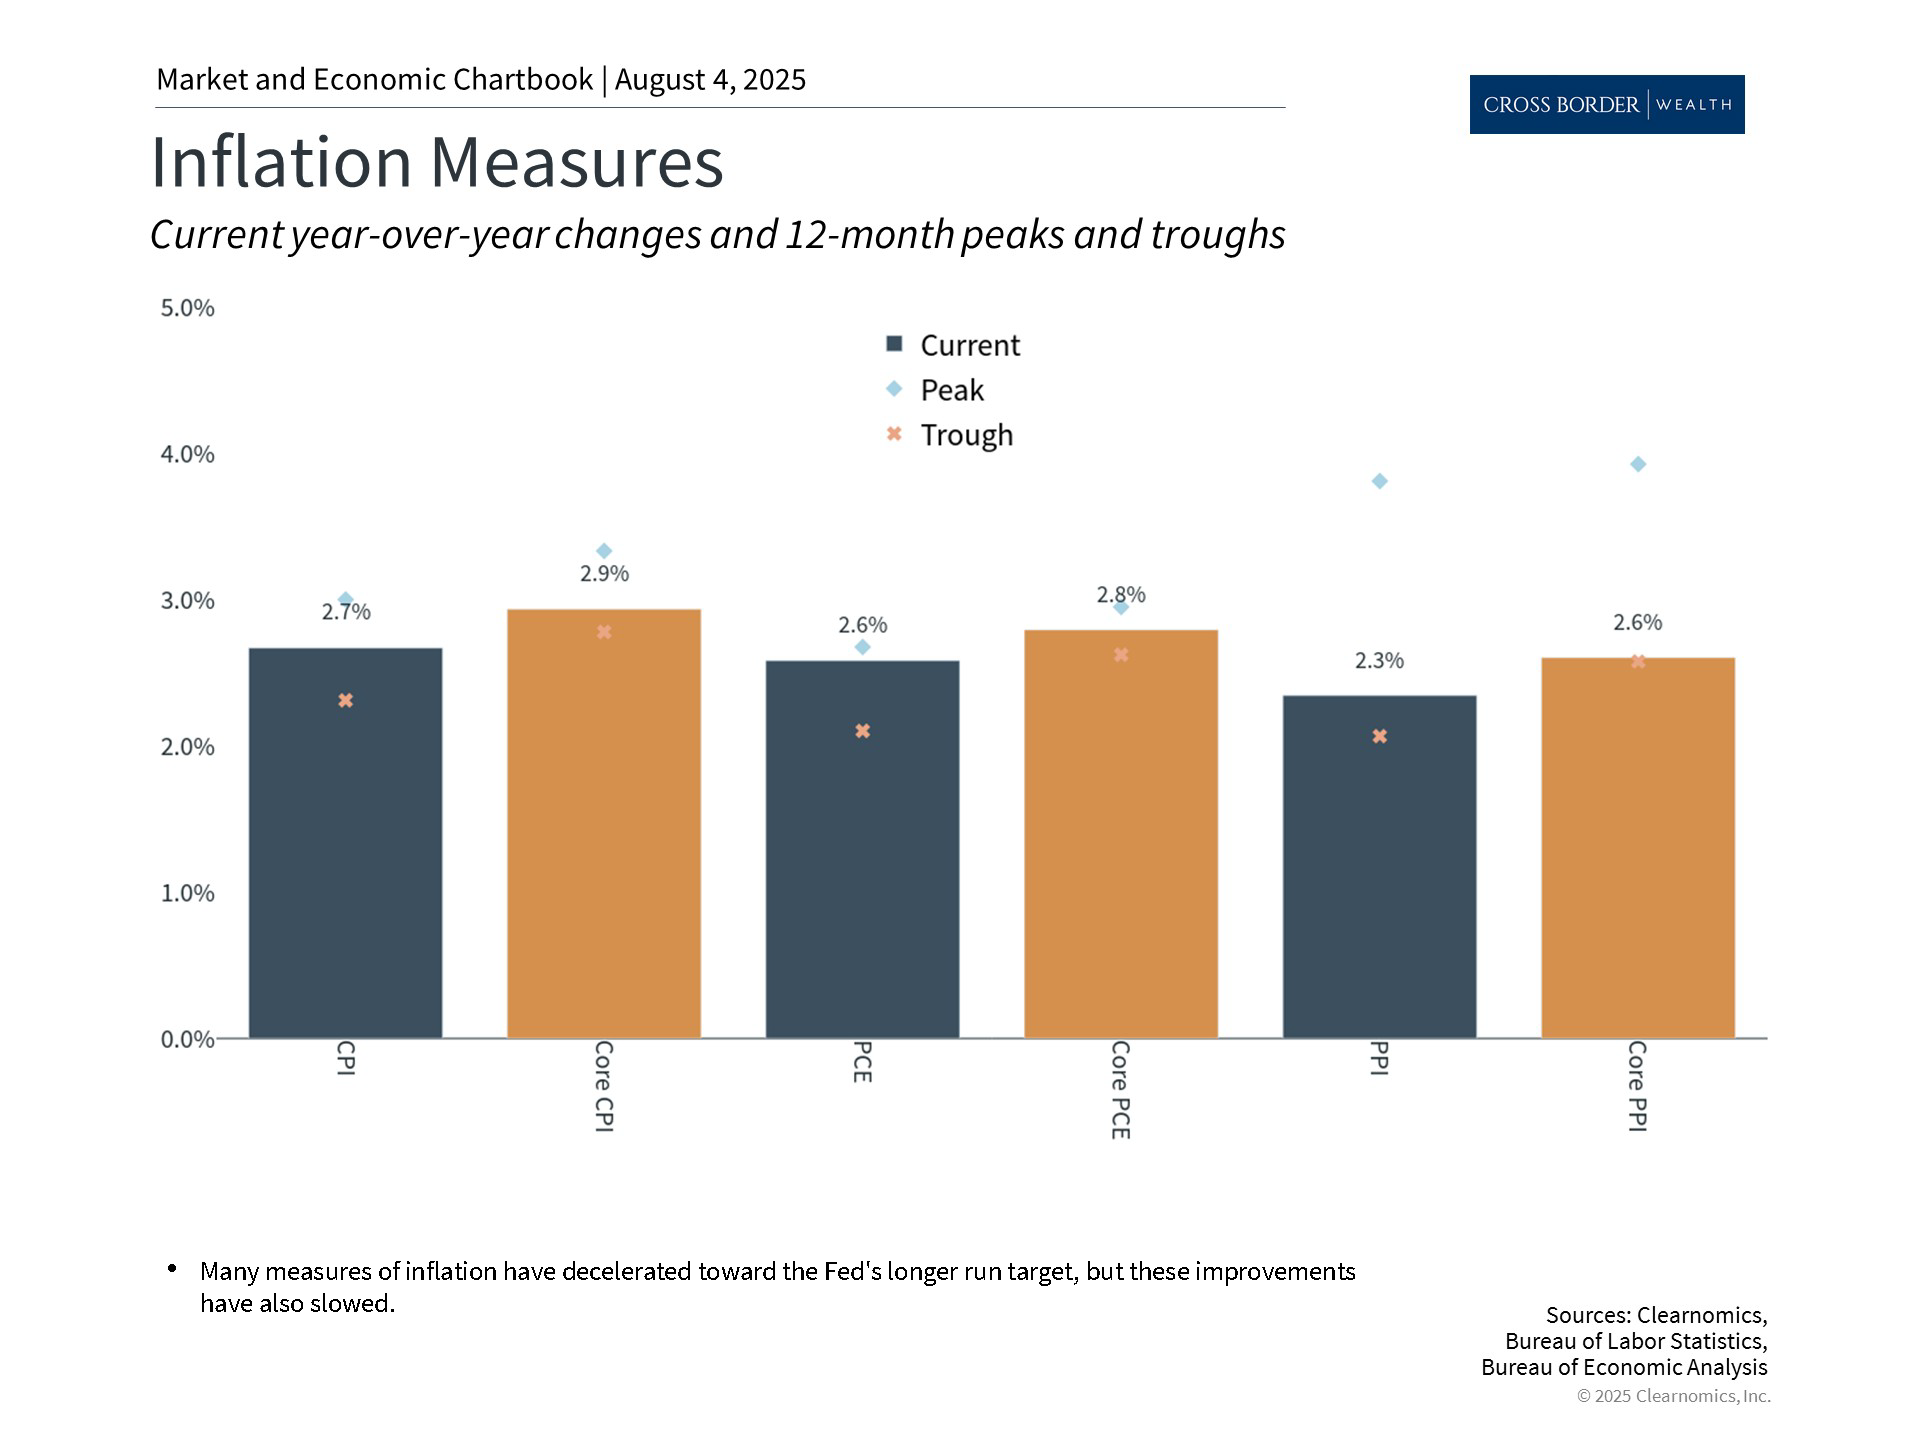
Tariffs remain the wildcard and are one important reason for mixed perspectives on the economy. Inflation has not yet picked up dramatically as some feared, but it does remain stubbornly above the Fed's 2% target.
Still, there are early signs that tariffs could be filtering through to consumer prices. According to the latest Consumer Price Index report, inflation for everyday consumer goods is accelerating even as price pressures for services are easing. In addition, the latest Personal Consumption Expenditures numbers show that inflation accelerated to 2.6% in June from a year earlier.
For investors, it’s normal for economic figures to point in slightly different directions, and even seem contradictory at times. This is sometimes due to economic uncertainty, and at other times due to measurement challenges. Regardless, it is the longer-term direction of the economy that really matters for investors, and utilizing different data sources is key to understanding the bigger picture.